Real-time observability and alerting
Deployment of Zabbix, Nagios, and Grafana with instant Telegram bot alerts for critical routers and servers. Before: no unified visibility, reactive failure detection dependent on user reports.
Key metrics
- Monitored hosts: 0 → 200+
- Checks per minute: 5k
- MTTR: 90 min → 30 min (67% less)
- Alerts: Telegram < 60 s
- Coverage: 100% of critical infra
- Routers/servers
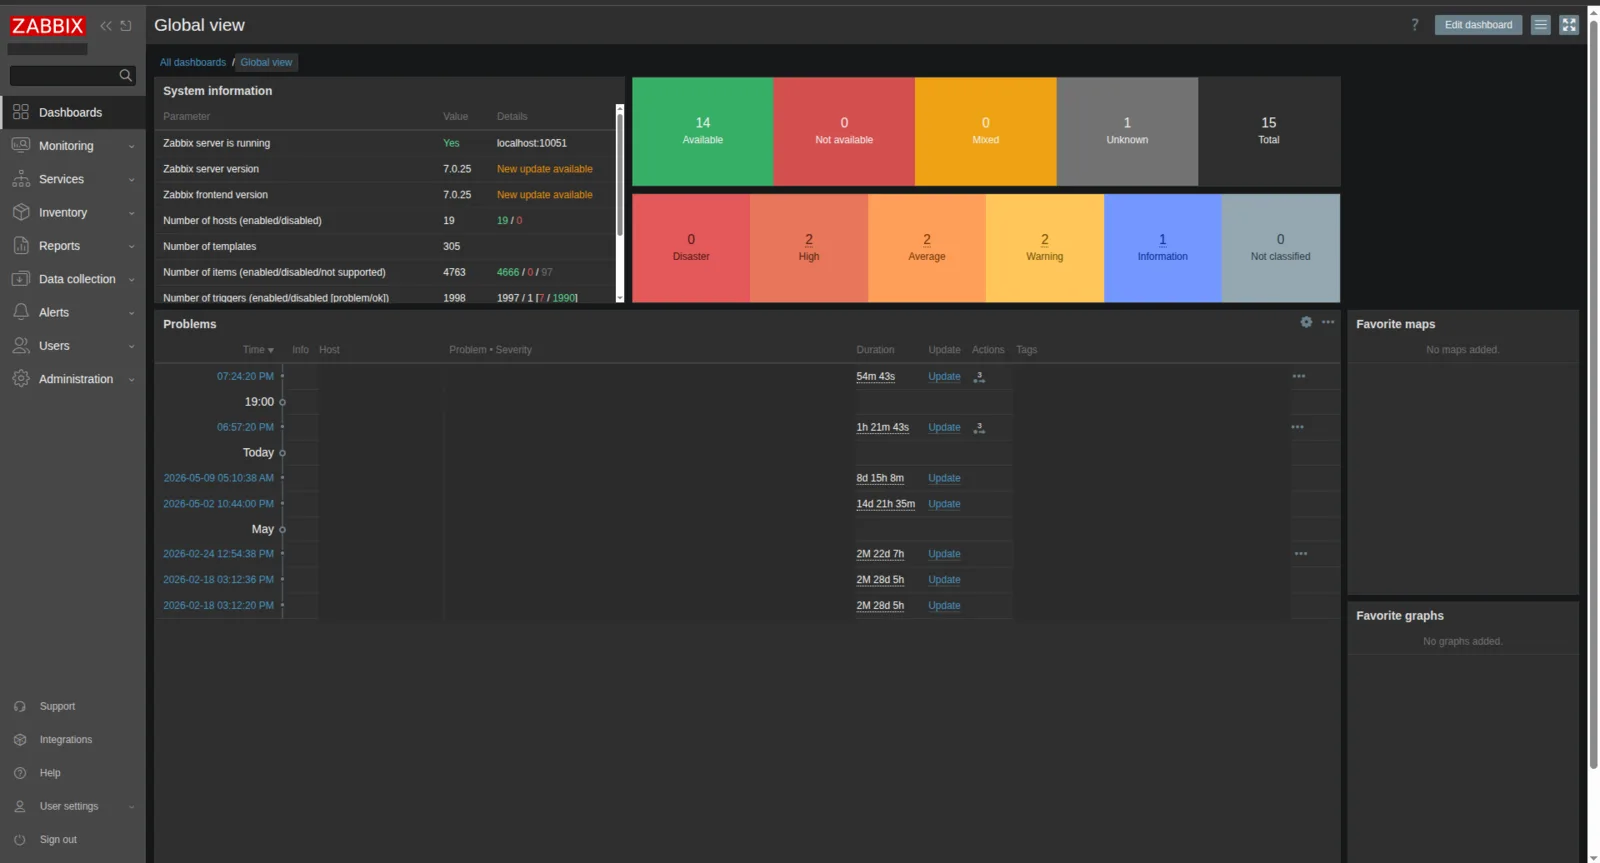
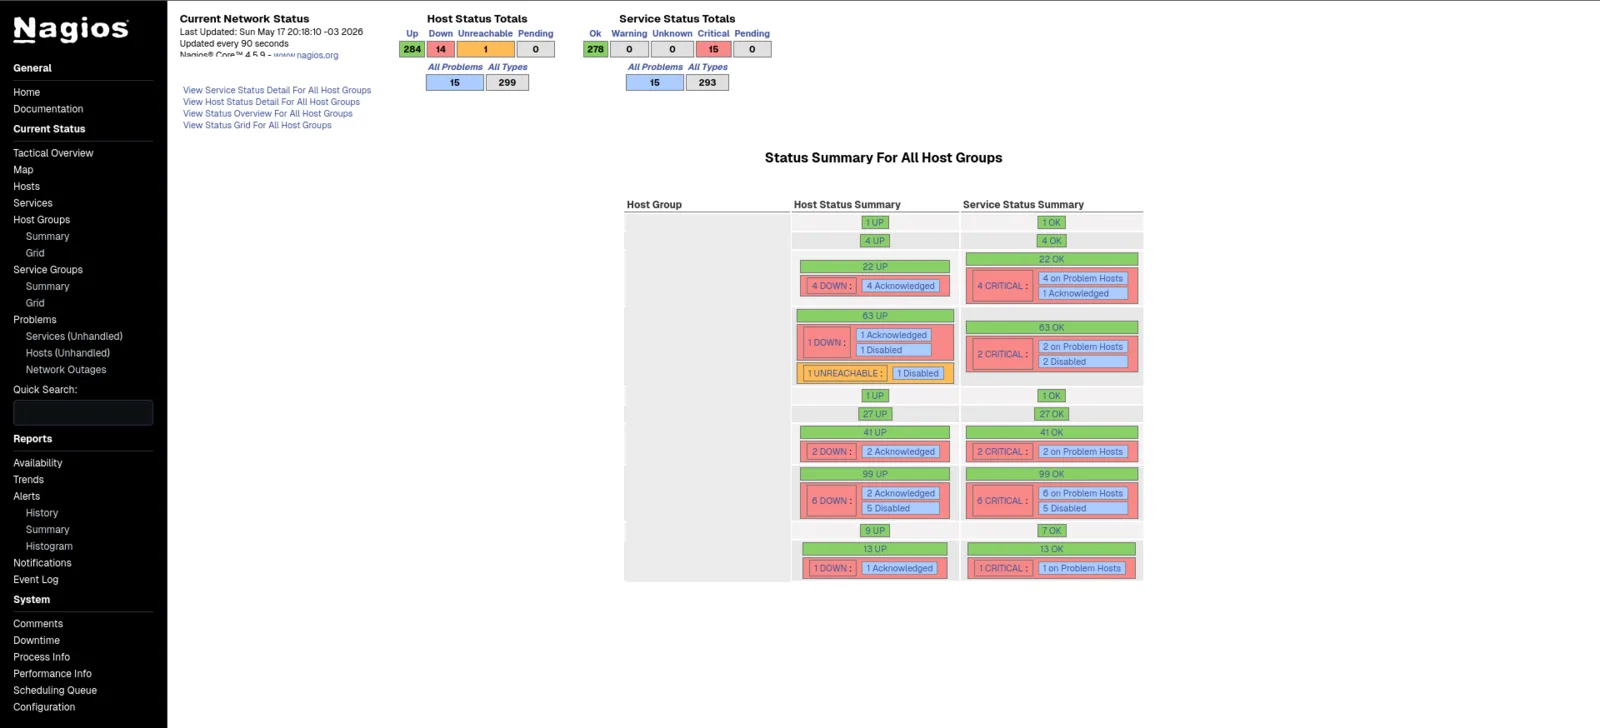
- Zabbix/Nagios
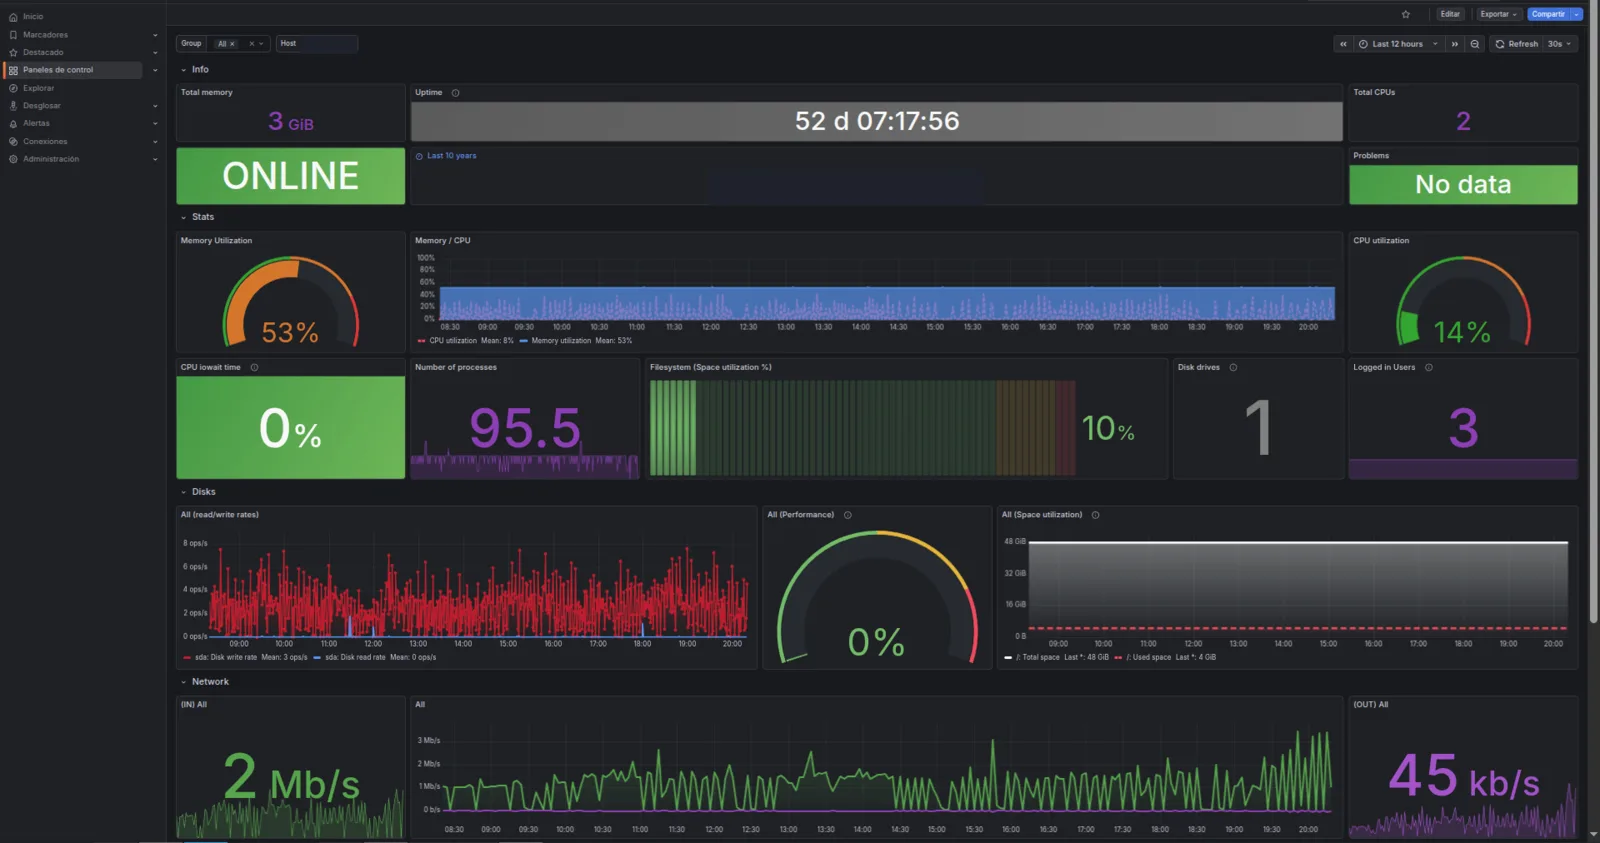
- Grafana
- Telegram alerts
Logical view without hosts, IPs, internal thresholds, or sensitive service names.
Context
The ISP's operation relied on manual failure detection. Alerts arrived through customer calls, not monitoring. There was no unified dashboard and no response-time metrics. The on-call team needed real-time visibility and actionable alerts.
Actions
- Deployed Zabbix to monitor core infrastructure and services (SNMP, ICMP, custom checks).
- Built Grafana dashboards for real-time tracking of traffic and router/server health.
- Integrated alerts with a Telegram bot: priority-based notifications, on-call group, and automatic escalation.
Results
- MTTR reduced from 90 to 30 minutes: incident response 3x faster.
- Alerts in under 60 seconds for critical events (link down, high CPU/memory usage, full disk).
- Unified operational dashboard: the NOC team moved from reactive to proactive monitoring.